

Create a New Report
Once you have a sufficient quantity of test data for one or more students, you can create a Report to view their test results.
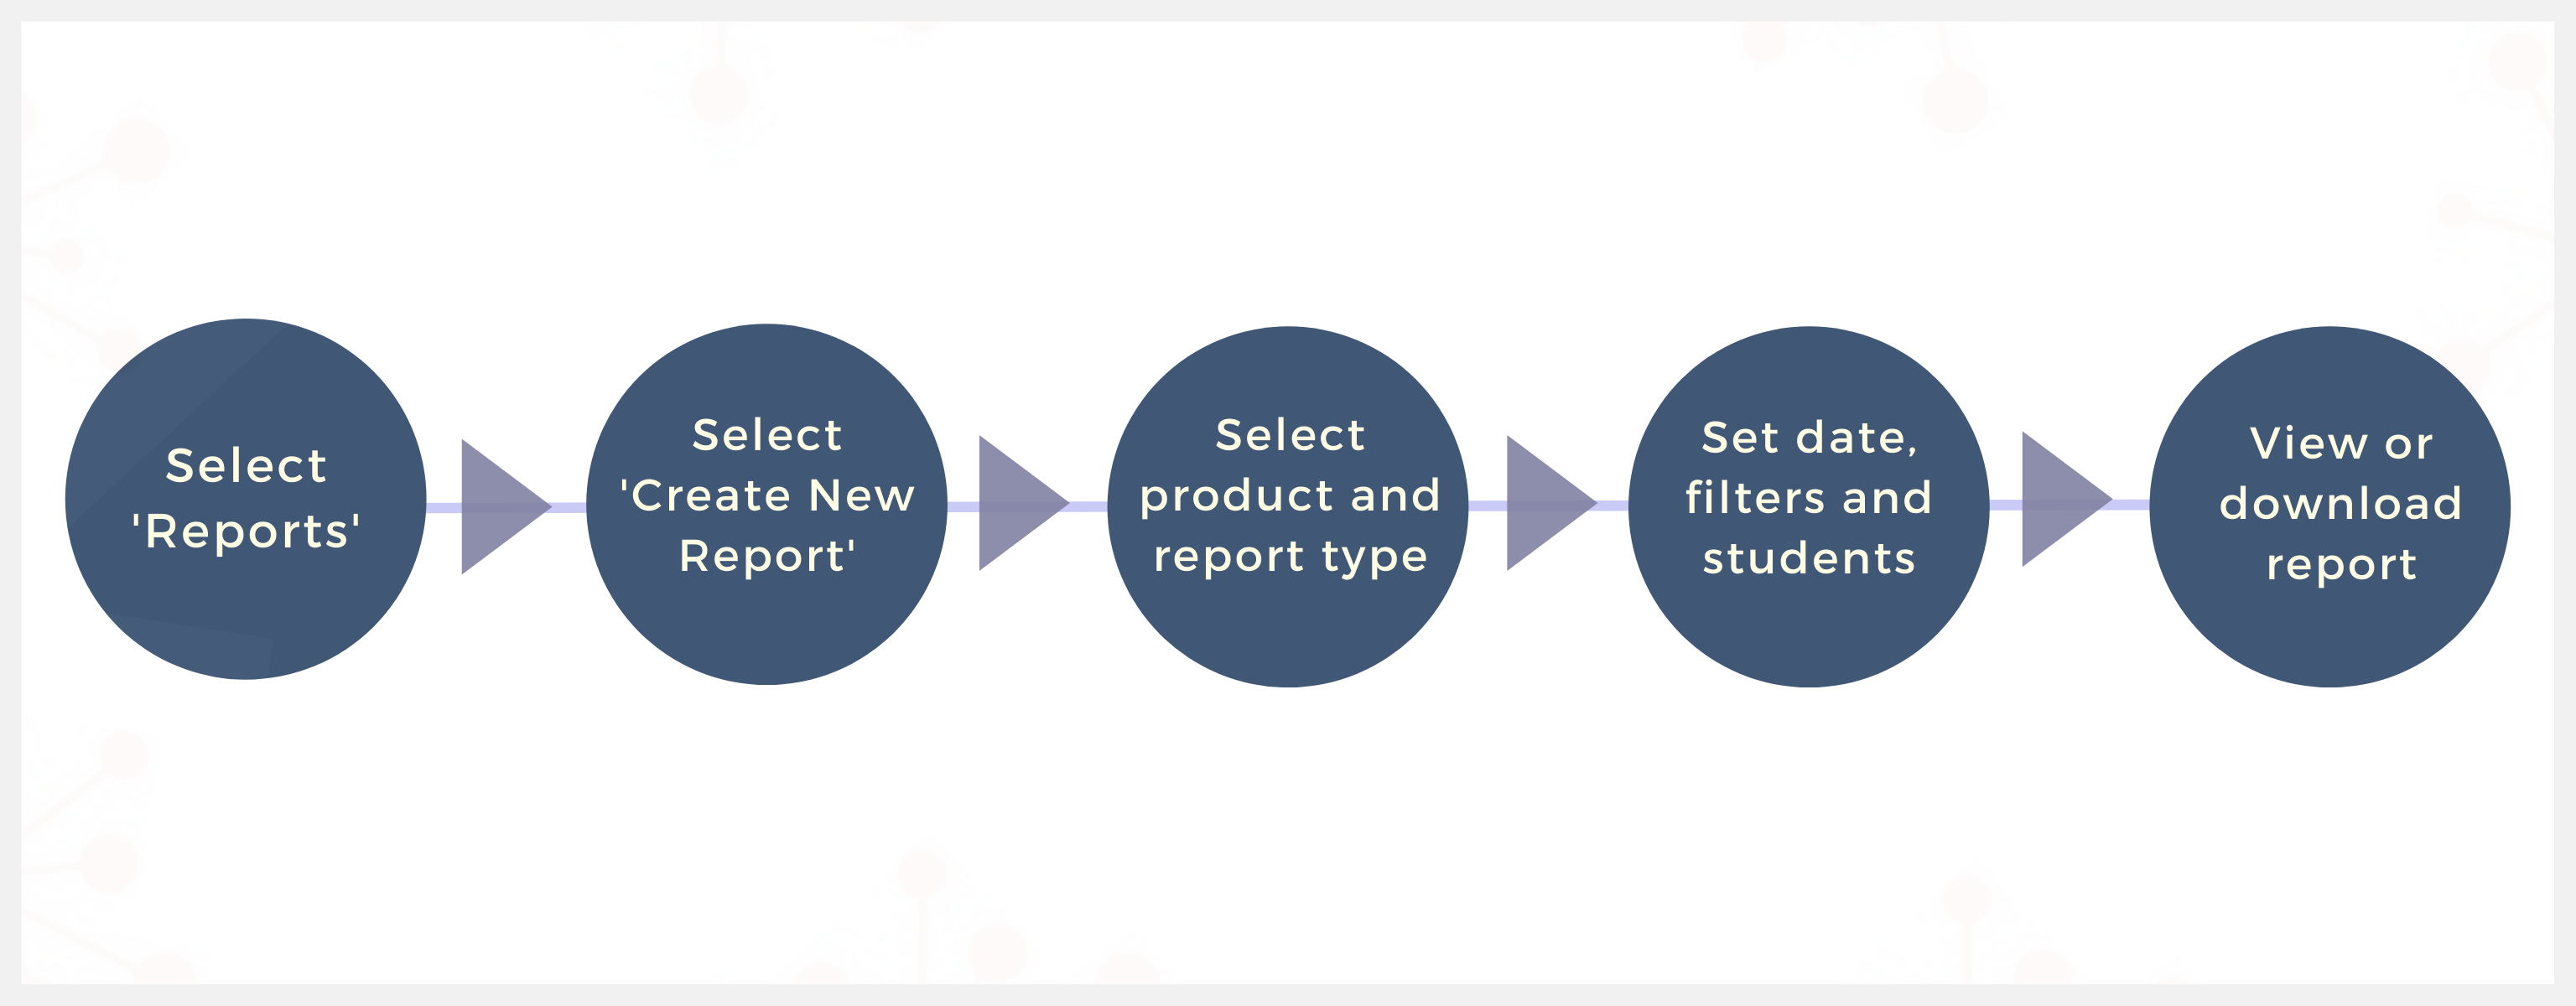
Each step in the diagram is described in detail in the procedure given below.
How to create a new report
1. Click the Reports button from the home screen. You will be shown a number of options. Select 'Create new report'.
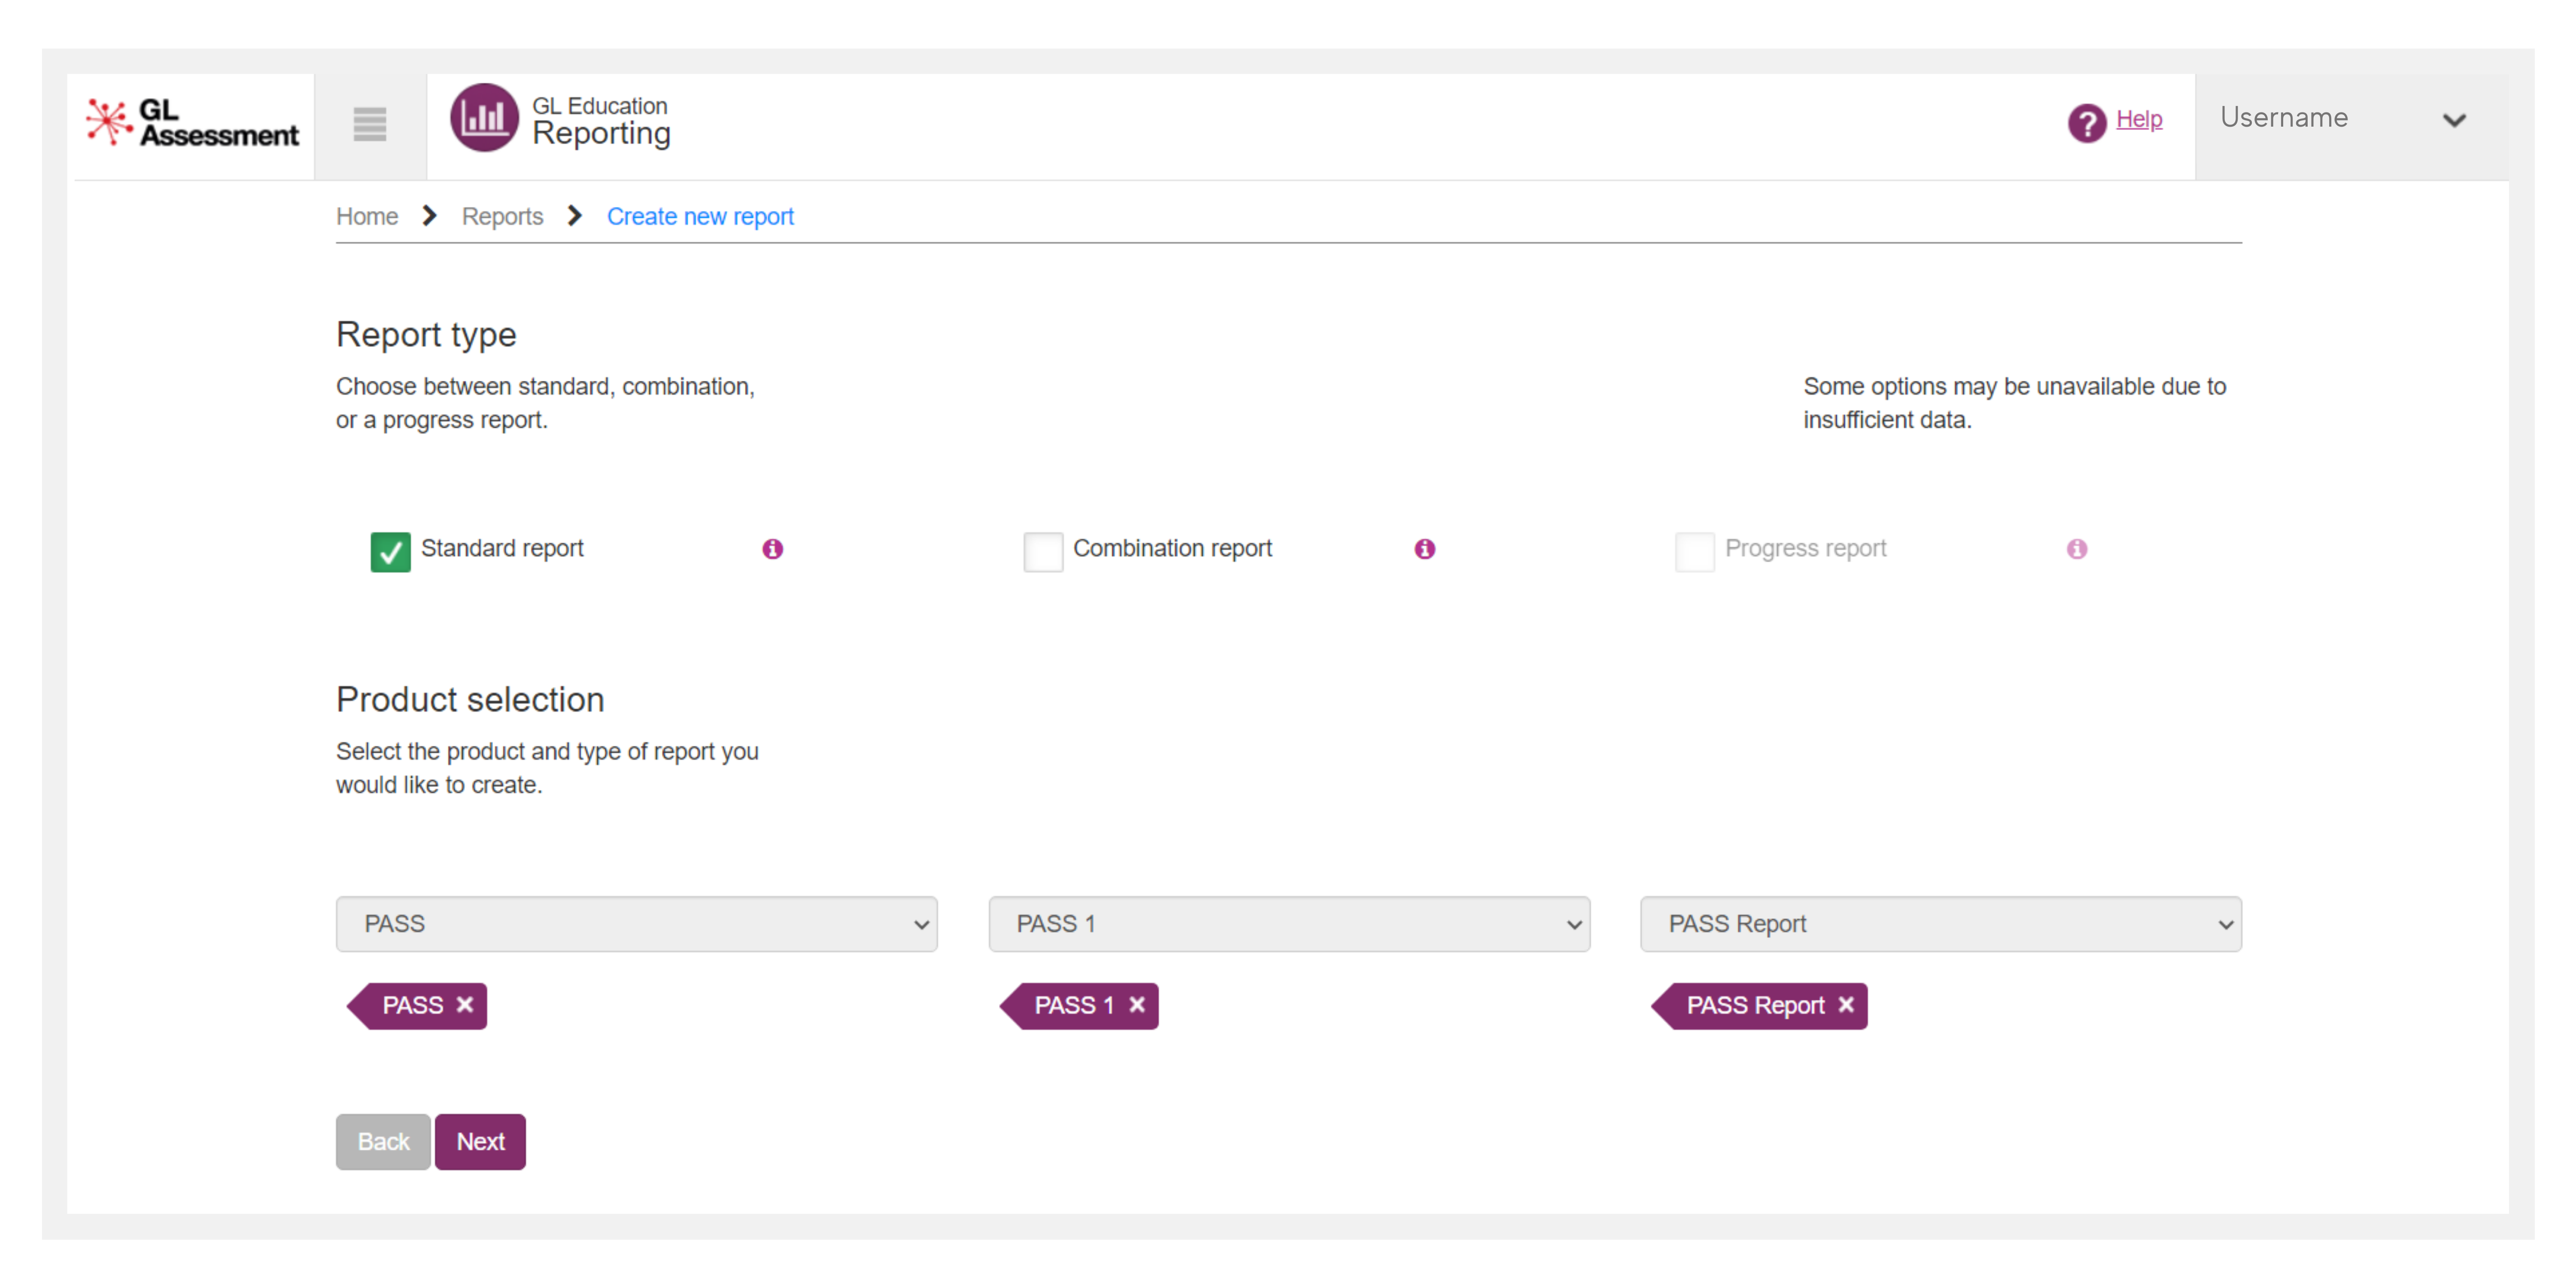
2. The default selection is for a standard report. If you wish to create a combination report (showing results from more than one product, eg. CAT4 and PTM), tick that option instead. This option will only be available to schools who have purchased the products and have the data to support its generation, as applicable. The same applies to a Progress report.
3. You will be prompted to select the product, level and report type. You will see your choices reflected under the selection box. If you wish to amend one of those choices, select the 'x' to remove and reselect an alternative.
Note: Only products, levels and Report types for which your school has data available will appear. If they are not shown, there is no data for them. Once all three choices have been completed, you will be able to press Next.
Set Date, Filters and Students
1. Give the report a name. It must not be longer than 100 characters. This is what will appear at the top of the report, so make sure it is clear and concise (eg. 'Year 8 Girls CAT4 Report').
2. Set the date range for the report.
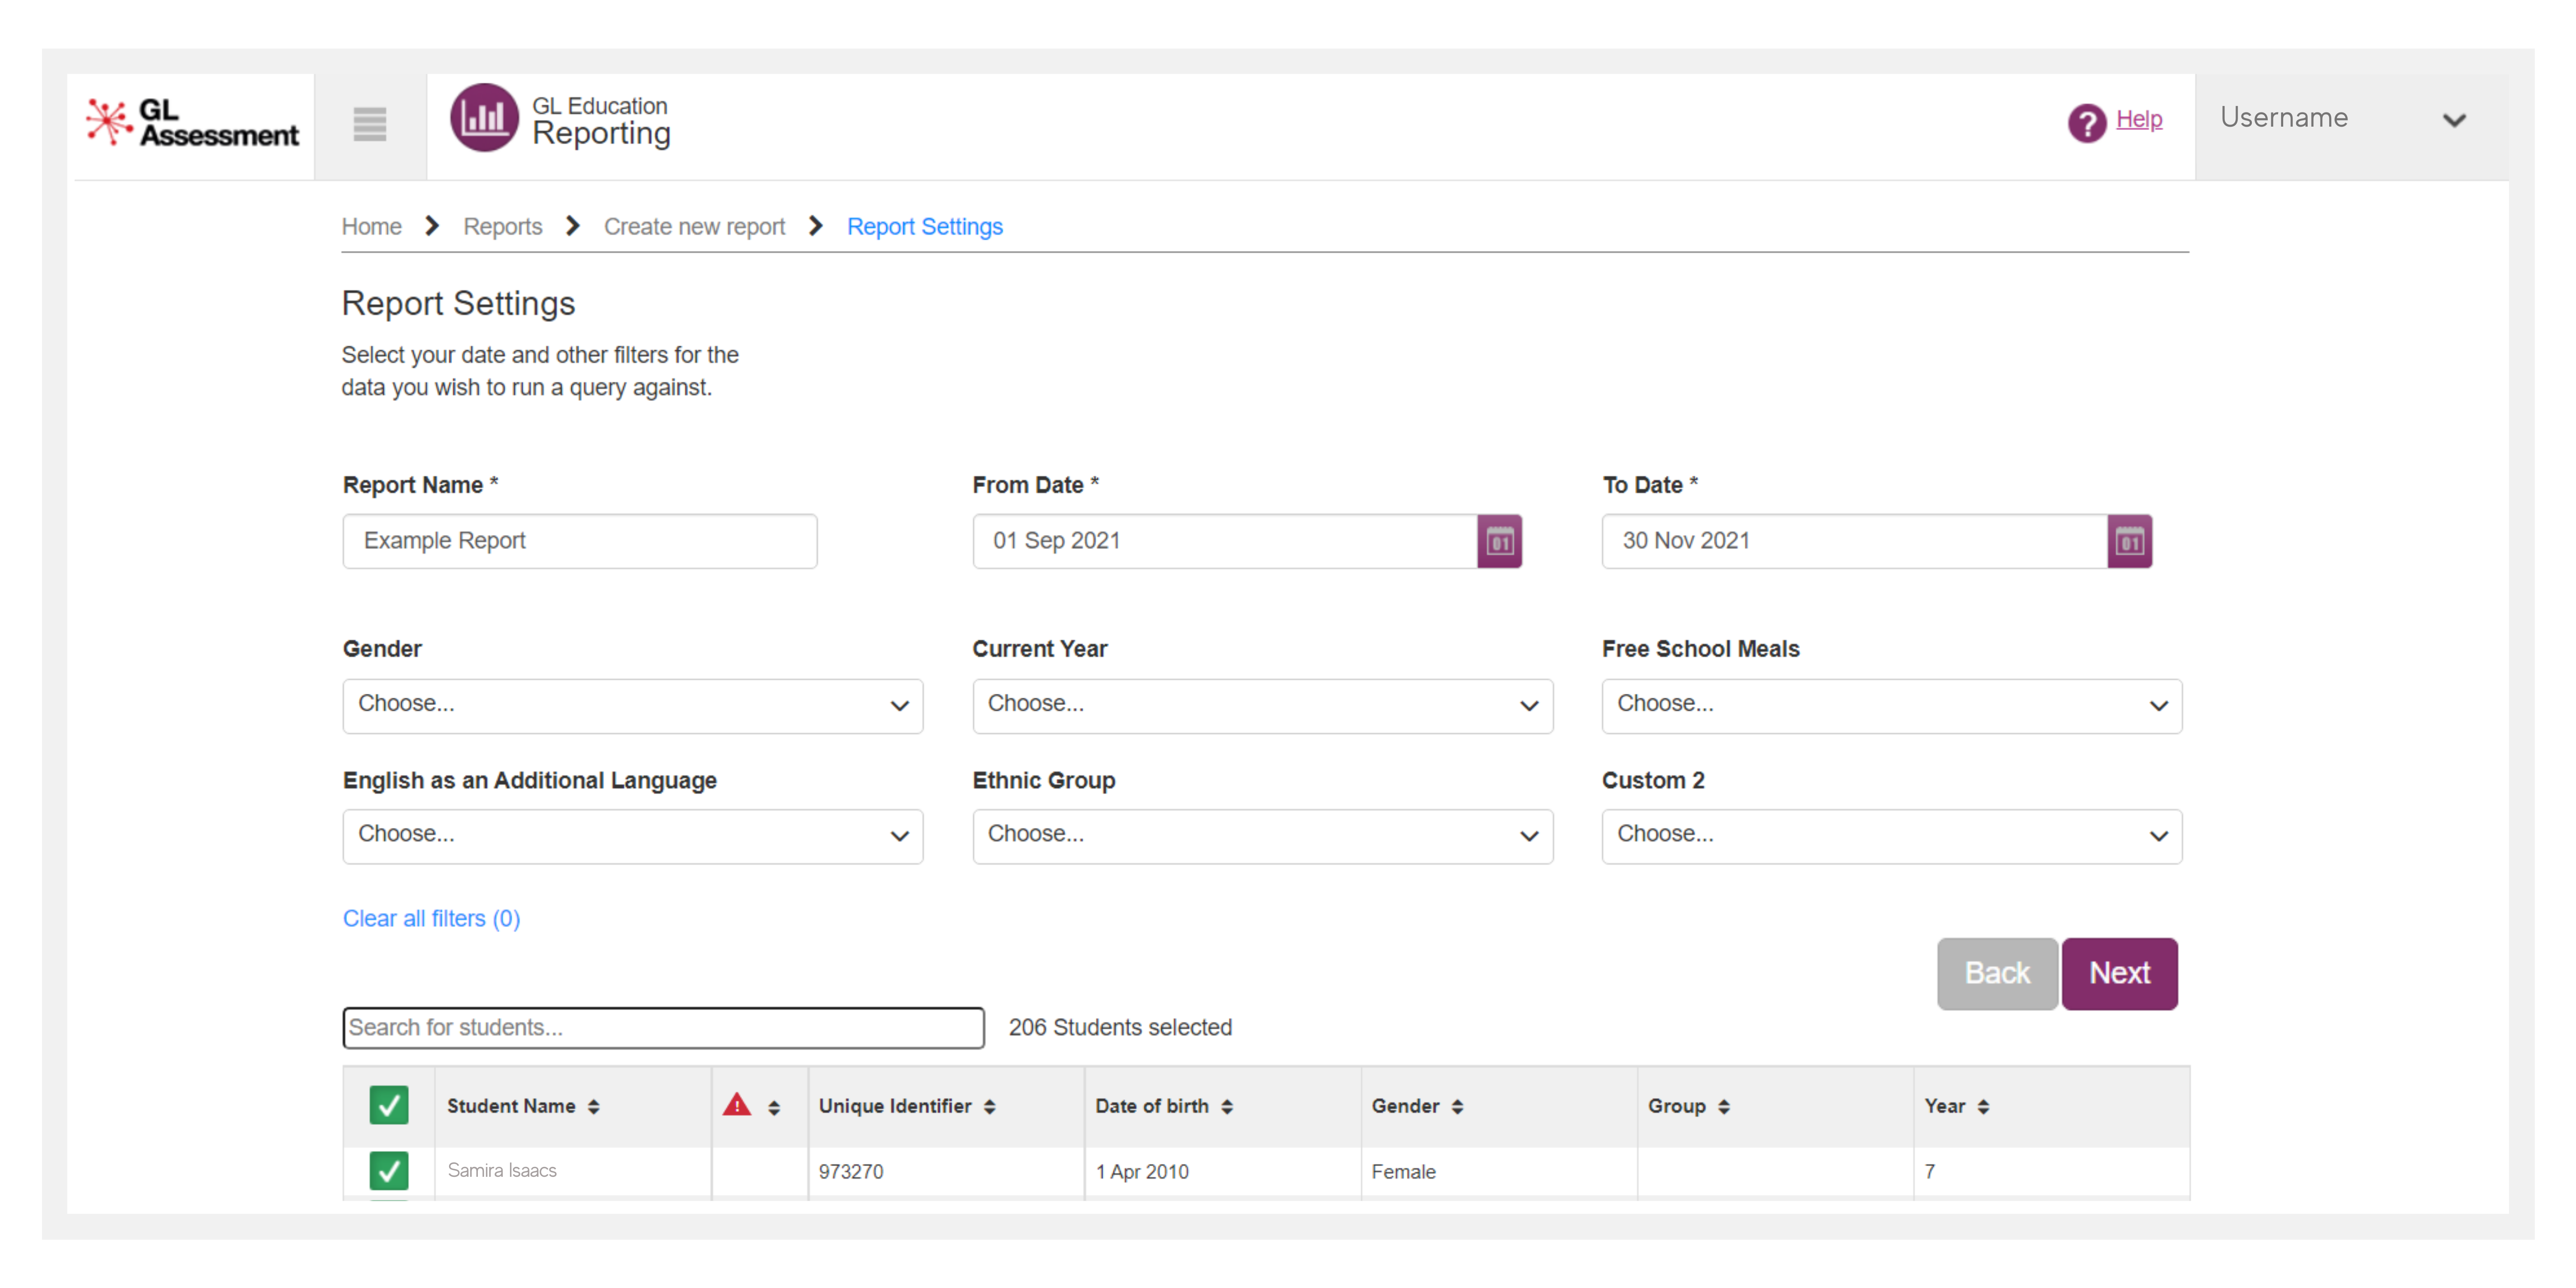
3. Once a date range is selected and the user clicks on Next, a number of different filters will appear (these are optional), along with the list of students due to be included in the Report. If a student has more than one test result on their record, the most recent result will be used in the report. This is shown using the yellow warning symbol that will appear next to the student's name. Hover over the symbol for an explanation message.
You will see a red triangle next to the student's name if they have only partially completed a test. You can still include partial results in the report if the product allows.
Note: The filters you see will change depending on what data is within the scope of the report you have chosen. The filters may not match the ones shown in the example below. The ones you see will be the uniquely relevant for your school and data set.
If you wish to further refine the list of students, select whichever filters you wish. The number of students selected will change as you apply and remove filters.
4. When you are happy with your filter selection (if any), you may optionally look at the list of students whose names will appear in the report. If you wish to, you can manually remove or add students.
5. When you are happy with your report settings, click on Next.
View or Download Report/Excel
1. You will be shown a summary of the report parameters you have selected. As with the filters, these vary by report type and data you have selected, so it may differ from the items shown below.
2. If you wish to amend any of what you have selected, press the Edit button next to the appropriate item. For certain report types, you will be given the option to enter a Group Name and make Country and Indicator selections.
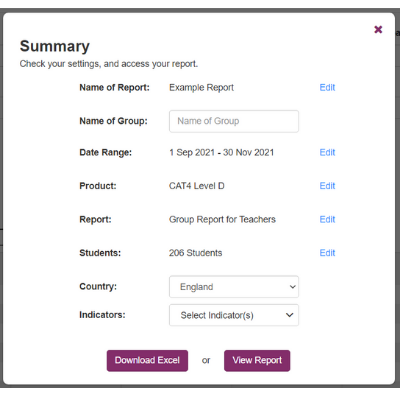
3. If you want an Excel report, click on Download Excel. From here you may view it or save it locally on your device.
4. If you want to view a report, click on the View Report button. You may be given a new-style online report, which will open in a new window. You may be informed that your PDF is being generated and will be saved into the My Documents folder, from where you may view it or save it locally on your device.
5. To return to the home screen, click on the Home button.