

Create a New Report
Once you have a sufficient quantity of test data for one or more students, you can create a Report to view their test results.
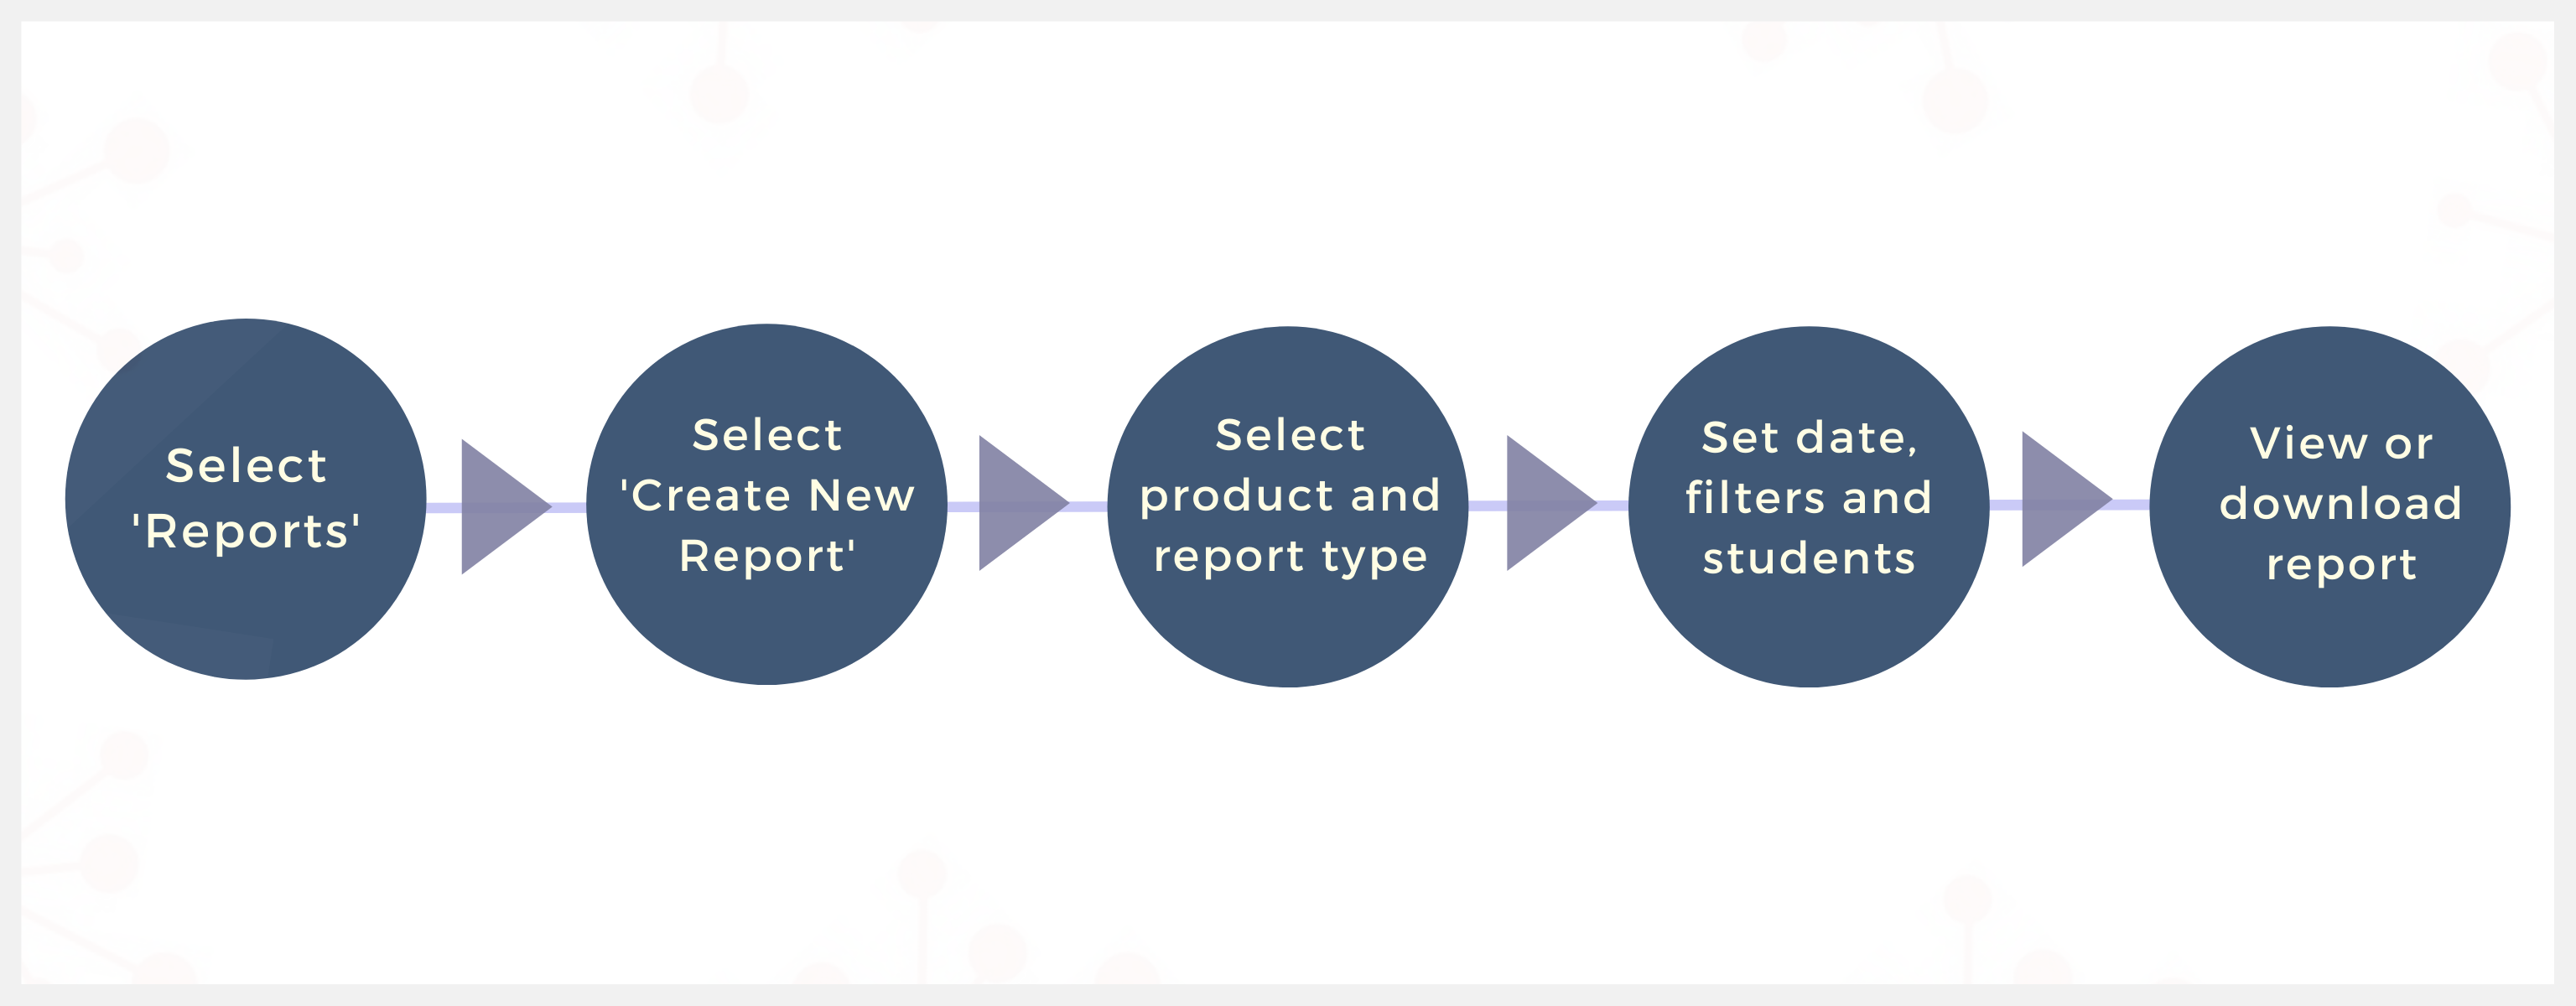
Each step in the diagram is described in detail in the procedure given below.
How to Create a Standard Report
A Standard Report can be created when one or more students have a sufficient quantity of data. A report can be created to view their results.
To Create Standard Report:
Click Insights and Reports
 on the Testwise home screen. You will be shown a number of reporting options.
Click Create report
 on the Insights and Reports page. This can be found under 'New Report'. This will display the types of reports that you can create.
Select Standard Report
 from the available options.
You will then be prompted to select the product, level and report type. Select your required product, level and report type in the relevant fields. To amend your selections when creating a report, you will need to return to this page and reinput your chosen product, level and/or report type.
Note: Only products, levels and report types for which your school has data available will appear. If they are not shown, there is no data for them.
Once completed, click Next
 to display the Date Selection page.
Use the Calendar icon
 to select the date range for the report.
Click Next
once the date range for the report has been selected. This will display the list of students whose data can be included within the report.If required, use the Filters
 to refine the list of students whose data will be included in the report. Filter options in the filter pane may include: Gender, Current Year, Free School Meals and Sitting.
Note: The filters you see on this page will change dependent on what data is within the scope of the report you have chosen. The filters you see will be uniquely relevant to your school and data set.
If required, use the Search Bar
 to search for a specific student.
If required, Select the Include Deactivated Students checkbox
 to include the results data of students who have been deactivated.
To ensure a student's data will be included in the report, select the checkbox to the left of their name.
Note: The checkbox will turn purple with a tick  when selected.
Click Next
once you have selected all the required students to have their data included in the report.Provide a Report Name. This will appear at the top of the report, so make sure it is clear and concise (e.g. Year 8 Girls CAT4 Report).
Note: A report name must be unique to a Testwise account and is a mandatory field (*).
There may also be other fields on this page that can be used to further refine the data to be included within the report. For example Country, Indicators or Group Name.
Note: The available fields on this page will be dependent on the product, product level and report type.
Click Next
to display the Report Summary where you can view the report parameters that you have selected.
Click Edit Report
 if you wish to amend your selections for the report.
Click Generate Report
 to proceed with the creation of the report.
Select one of the below options:
If you want an Excel report, click on Download Excel, from here you may save it locally on your device.
If you want to view a report, click on the View Report button. You may be given an online report, which will open in a new window. You may be informed that your PDF is being generated and will be saved into the My Documents folder, from where you may view it or save it locally on your device.
The generated report will now be available for download in Downloaded Reports. This is where you can view all previously created PDF and Excel reports.
How to Create a Combination Report
A Combination Report compares results from various attainment tests and CAT4. The results can be used to compare the potential attainment of a student, as determined by CAT4, and their ongoing attainment. For information regarding the products that can be included within a Combination Report, a guide is available in Downloads.
To Create a Combination Report:
Click Insights and Reports
on the Testwise home screen. This will display a number of reporting options.Select Create report
on the Insight and Reports page. This can be found under 'New Report'. This will display the types of reports that you can create.Select Combination Report
 from the available options.
Use the Calendar icon
to select the date range for the report.Click Next
once the date range has been selected. This will display the Report Settings page.Select the combination of products that you would like to include in the report in the fields displayed (e.g. Product 1* and Product 2*). Only relevant products for which there is data within the established date range will be displayed.
Note: Some options will allow for a third product to be available for selection, some will limit the selection to two.
Click Next
once you have determined the products to be included within the report. This will display a list of students to be included within the report.To ensure a student's data will be included in the report, select the checkbox to the left of the student's name.
Note: The checkbox will turn purple with a tick when selected.
If required, use the Filters
to refine the list of students whose data will be included in the report. Filter options in the filter panes may include: Gender, Current Year, FSM and EAL.
Note: The filters available will be dependent on your school and data set.
If required, use the Search Bar
to search for a specific student.Select the Include Deactivated Students checkbox
to include the results data of students who have been deactivated in the report.Click Next
once all the required students have been selected to have their data included in the report.Provide a Report Name. This will appear at the top of the report, so make sure it is clear and concise (e.g. Year 8 Girls CAT4 Report).
Note: A report name must be unique to a Testwise account and is a mandatory field.
There may also be other fields on this page that can be used to further refine the report. For example: Score Type (SAS/Stanine) and Country.
Click Next
once completed to view the Report Summary page. Here you can see all the report parameters that you have selected.Click Edit Report
if you wish to amend your selections for the report.Click Generate Report
to proceed with the creation of the report.
Select the format of the report:
Generate Excel Report.
Generate PDF Report.
Your created Combination Report can now be viewed and saved onto a local system and distributed where required.
The generated report will now be available for download in Downloaded Reports. This is where you can view all previously created PDF and Excel reports. Return to the Insights and Reports and click View reports under Downloaded Reports to access this page.
Note: Reports can take between 15-30 minutes to fully populate. Reports run before this may exclude some student data.