

Standardisation and norms
Standardisation and norms
Technically, ‘standardisation’ is the process used in psychometric test development to create norms so that the performance of students of different ages can be represented by means of scores that are independent of age. However, the term ‘standardised’ is sometimes used in a non-technical sense to refer to the consistent administration of a test – i.e. test instructions and methods of administration are the same for all who take the test. Because this non-technical usage can be misleading (e.g. users may assume that a test has standardised norms when in fact it hasn’t), we only use the terms ‘standardisation’ or ‘standardised’ in strict accordance with technical psychometric usage.
The most common normative scores are standard scores and percentile scores. Standard scores have a mean (average) of 100 and a standard deviation6 of 15. Percentile scores place individuals on a ‘ladder’ of attainment from 1 to 100 compared with the population of that age; e.g. a percentile score of 70 means that 70% of people would have lower raw scores and 30% would have higher raw scores. (For further information about standard scores and percentile scores see Types of scores).
The standardisation sample for Exact comprised 1,171 students aged from 11:0–18:11. The students were drawn from 17 schools across the UK, selected to give a representative spread of types of school and socio-economic profiles. The basic results are shown in Table 1. Exact test results for the standardisation sample.
It can be seen in Table 1. Exact test results for the standardisation sample, that Forms A and B are very similar in all tests except reading comprehension, where Form A has a slightly higher mean score and thus would appear to be slightly easier than Form B. However, this difference is taken into account in the norms, so the two forms are still psychometrically equivalent.
All raw data, except those for the word recognition test, approximated to normal distributions (symmetrical bell-shaped curves), with skewness (the degree of asymmetricality of the distribution) and kurtosis (the degree of flatness and peakedness of the distribution) below the critical threshold of 1.0. The distributions of raw scores for the word recognition test were negatively skewed – i.e. scores were found to bunch towards the upper end of the scale. For this particular test, therefore, the raw score was transformed to give the normal distribution that is necessary for satisfactory generation of standard scores. This statistical transformation, which took into account the speed of response, had minimal effect on the scores of students with a raw score below the mean but, as intended, had a somewhat greater effect on scores above the mean. For students who have below average word recognition, over 70% of the variance in transformed score is predicted by raw score – i.e. for these students the standard score produced by this test is largely a function of their reading accuracy rather than speed. For students whose word recognition is highly skilled, however, differences are largely a function of speed rather than accuracy.
Table 1. Exact test results for the standardisation sample
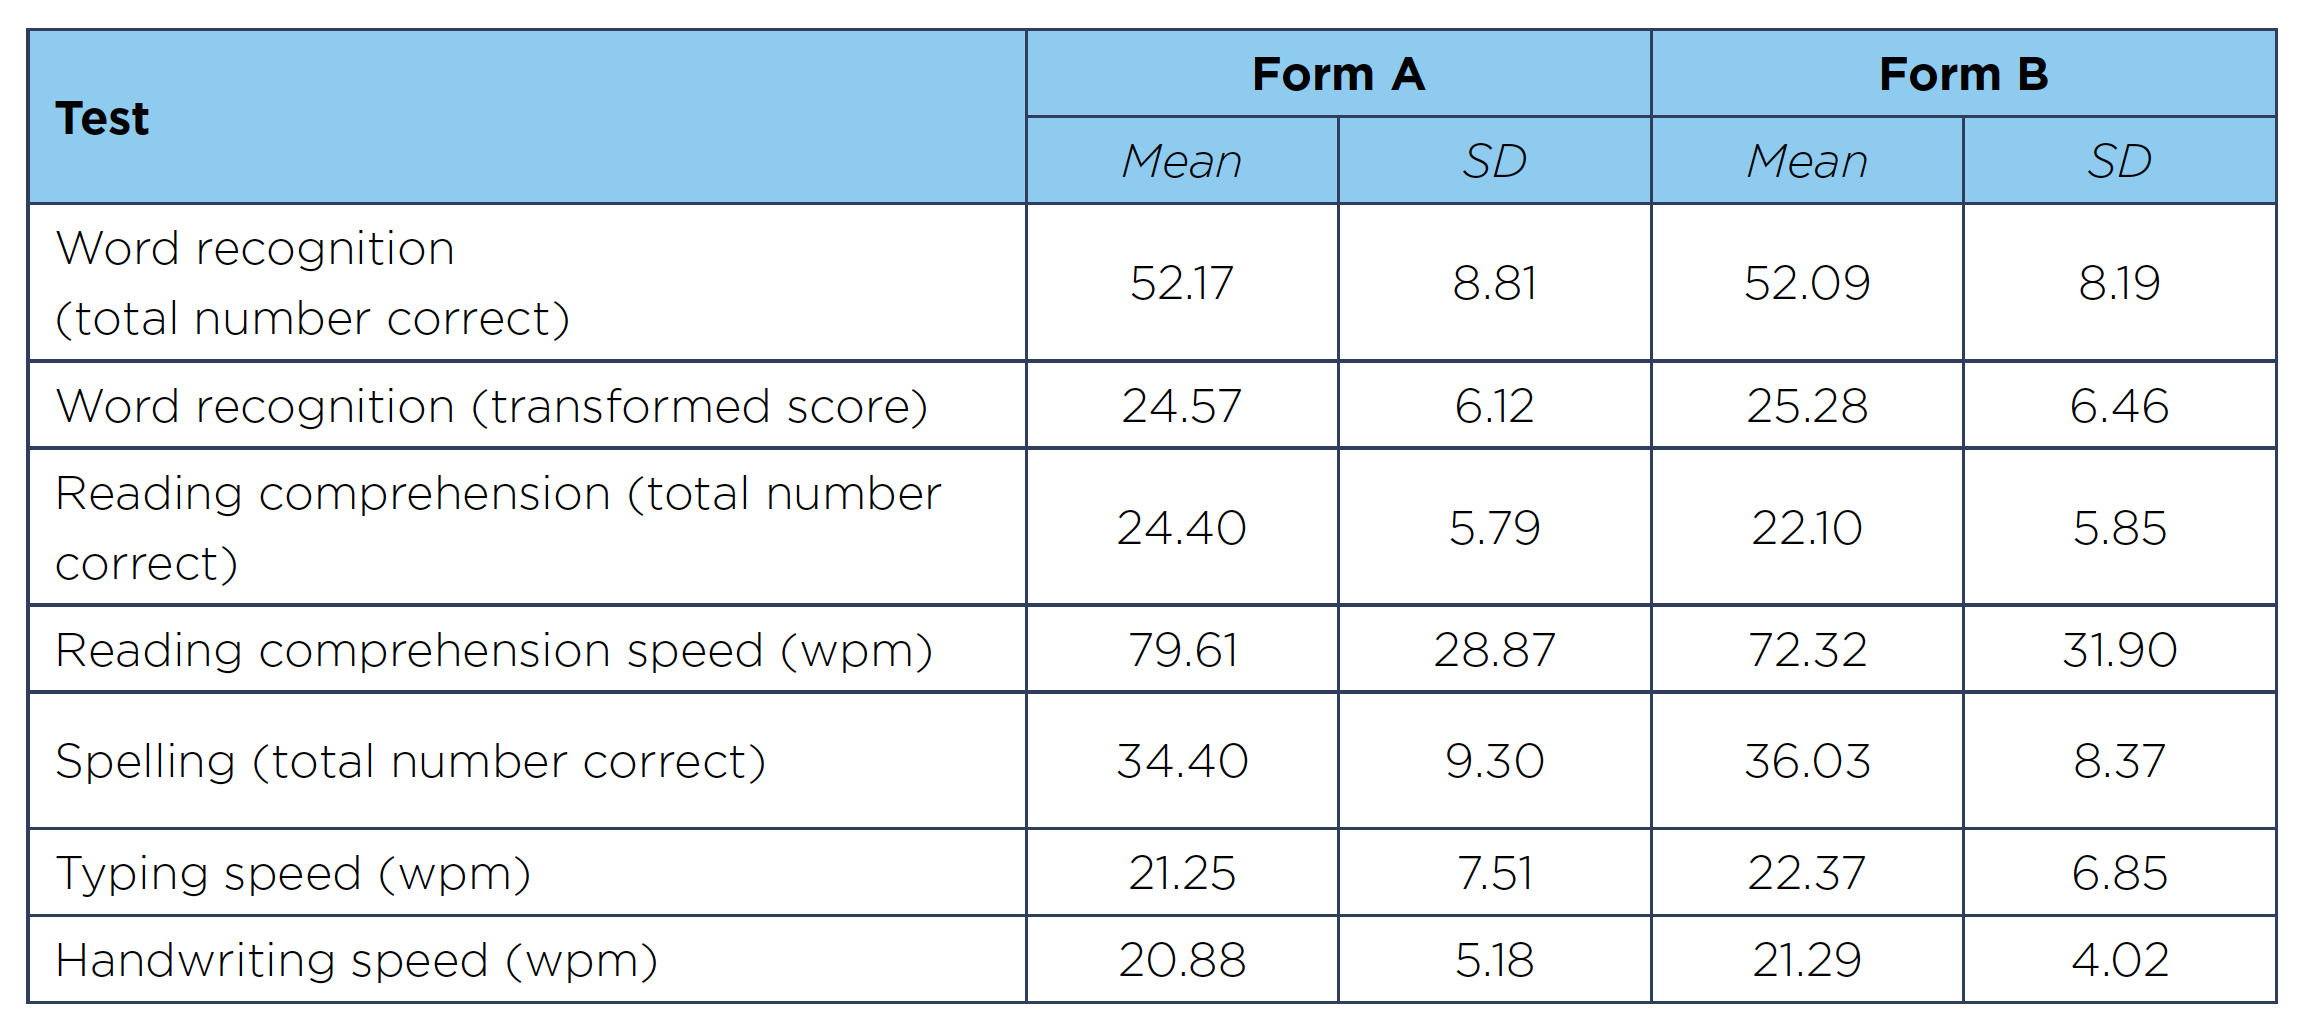
SD=standard deviation.
Normative results in standard score and percentile score form are incorporated into the Exact program. The norms are provided in 3-month age bands from 11:0 to 18:11 and in 12-month age bands from 19:0 to 24:11. Standard scores and percentile scores for the age range 19:0 to 24:11 were calculated by extrapolation. Age equivalents were calculated for the age range 6:0 to 18:11 (over this age, age equivalents become meaningless). Age equivalents in the 6:0 to 10:11 range were calculated by extrapolation.
6 The standard deviation is the most common statistic for expressing variability in a set of scores and is calculated as the average amount by which the scores in the set deviate from the mean.