

Understanding the NVR scores
Non-Verbal Reasoning (digital only) will not be available after 3 December. Contact [email protected] for support
Raw score
The raw score is simply the total number of correct answers obtained by the pupil. These scores can be converted to three types of normative scores called standard age scores (SAS), stanines and percentiles. These are described below.
Standard age Score (SAS)
One way to make a raw score more readily understandable would be to convert it to a percentage: for example, ‘33 out of 50’ becomes 66%. However, the percentage on its own does not tell us the average score of all the pupils or how spread out the scores are, whereas standard age scores do relate to these statistics.
In order to provide a standard age (or standard score) scale, some tests are standardised so that the average standard age score for any age group is always 100. This makes it easy to tell whether a pupil is above or below the national average. The spread of scores (the ‘standard deviation’) is also set to plus or minus 15 points, so that for any age group about two-thirds of the pupils in the national sample will have a standardised score of between 85 and 115.NVRand VR were standardised in 1992 using a national sample of maintained and independent schools in England and Wales.

Raw scores are converted to standard age scores that allow you to compare the level of cognitive development of an individual with the levels of other pupils in the same age group. The properties of standard age scores mean that approximately two-thirds of pupils in the age group score between 85 and 115,approximately 95 per cent score between 70 and 130, and over 99 per cent score between 60 and 140. Figure 1.1 shows the frequency distribution, known as the normal distribution, for standard age scores, stanines and percentiles.
Standard age scores have three particular benefits, as described below.
•They place a pupil’s performance on a readily understandable scale. As we have seen above, standard age scores allow a pupil’s performance to be readily interpreted. It is immediately deducible from the score itself that anon-verbal reasoning score of 95 indicates a level of performance just below the national average, but well within the average range.
•An allowance can be made for the different ages of the pupils. In a typical class the oldest pupils are very nearly 12 months older than the youngest. Almost invariably, older pupils achieve slightly higher raw scores in tests and examinations than younger pupils. However, standard age scores are derived in such a way that the ages of the pupils are taken into account by comparing a pupil only with others of the same age. An older pupil may in fact gain a higher raw score than a younger pupil, but have a lower standardised score. This is because the older pupil is being compared with other older pupils in the norm group. Pupils of different ages who gain the same standard age score have done equally well, with each being judged in relation to their standing among pupils of their own age.
•Scores from different tests can be meaningfully added or compared. Standardised scores for most tests cover the same range, from 60- to 140+.Hence a pupil’s standing, in say mathematics and English, can be compared directly using standardised scores. It is not meaningful to add together raw scores from tests of different length or difficulty. However, should you wish to add standardised scores from more than one test – for example, in order to obtain a single overall measure of attainment – they can be meaningfully combined.
Stanines
Standard scores run from 60- to 140+ and give differentiated, finely graded information on the performance of each pupil. However, sometimes a shorthand summary is more useful. Stanines, short for ‘standard nines’, are just nine summary score bands calculated directly from the standard scores, as shown in Table 1.3. Based on the national standardisation, we can say what proportion of pupils are expected within each stanine, and these are also given in the table. The broad nature of stanines minimises over-interpretation of small, insignificant differences among test scores. Stanines are therefore particularly useful in reporting test information to pupils and to parents, as they are relatively easy to understand and interpret.
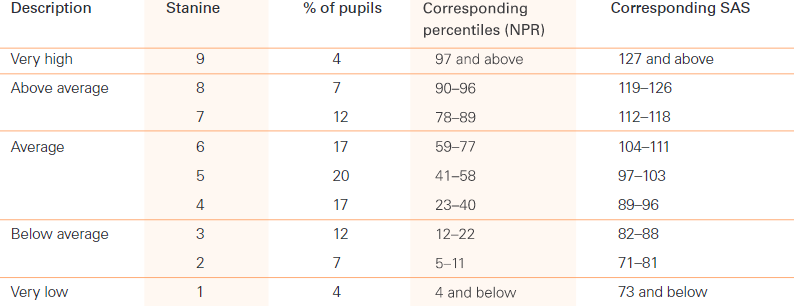
Table 1.3: Stanines score bands for NVR
National percentile rank (NPR)
This indicates the percentage of pupils in the national sample who obtain a standard age score at or below a particular score. For example, a pupil with a standard age score of 108 has a national percentile rank (NPR) of 70. He or she has performed as well as, or better than, 70 per cent of pupils of his or her age group. An NPR of 50 is average for an age group.
Confidence bands
Pupils’ standard scores are also shown as a vertical line with a horizontal line showing the 90 per cent confidence band. It is recognised that any test score represents a performance on a particular day, and the score should therefore be placed within such a confidence band. If the test were taken again, nine times out of ten one would expect the score to fall within this range.